The effect of new signal processing techniques on real world satisfaction in key listening situations.
2020-09-16 White Paper Eric Branda, AuD, PhD; Erik Harry Høydal, MSc.; Christina Hakvoort, MBA
Introduction
Digital hearing aids have since their introduction been the fitting routine of choice. It has during this time been common for major manufacturers to introduce a new digital platform every 2 years or so. Given the need for audiologists to maintain evidencedbased practice, it is therefore the task of each manufacturer to prove that indeed patient benefits with the new products are present. This typically is accomplished though efficacy studies in the laboratory, as well as real-world assessment of benefit.
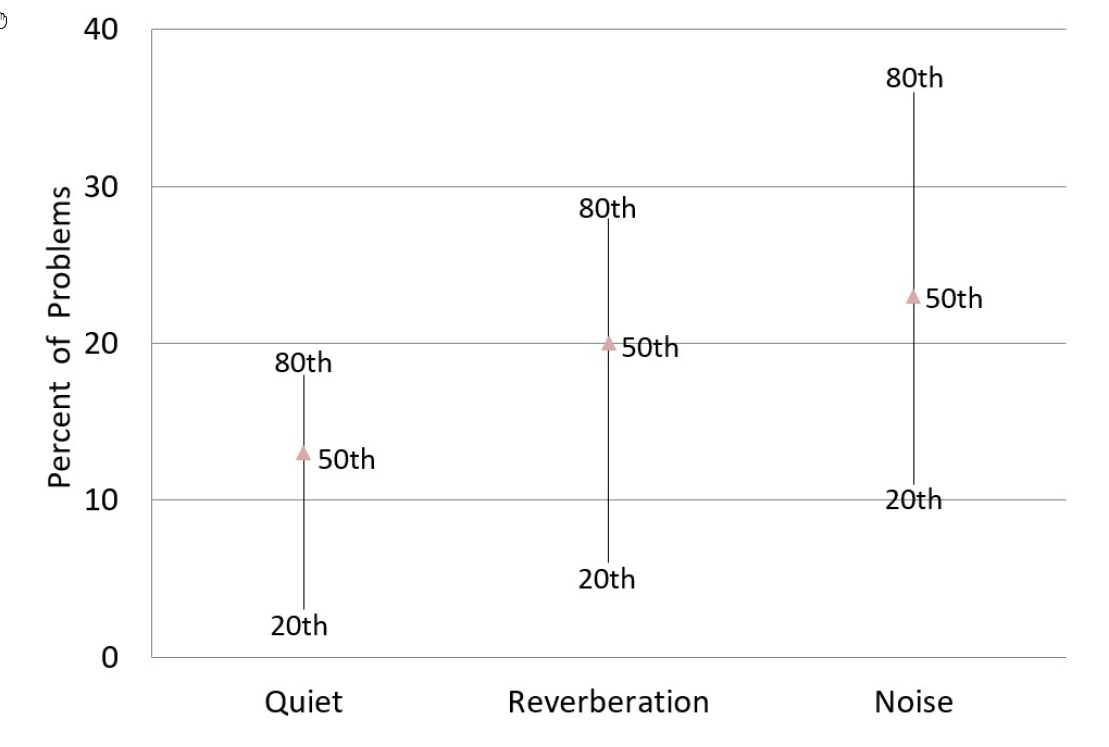
However, establishing significant improvement over previous products becomes more difficult for several reasons. One relates to the performance of people with normal hearing. Essentially, people with normal hearing also have speech understanding problems in the same listening situations as those using hearing aids. There are not a lot of data on this topic, but one example is from Robyn Cox’s research going back to when the Abbreviated Profile for Hearing Aid Benefit (APHAB) was introduced (Cox,1997). It is common knowledge that hearing aid users have problems in background noise. But the data also showed that the participating normal hearing individuals, observe in Figure 1, also have problems in background noise (50th percentile 23%; 80th percentile 36%). At what point then, have we reached the satisfaction ceiling for eliminating problems in background noise?
Figure 1. Percent of problems for older individuals with normal or near-normal hearing for three categories of the APHAB: listening in quiet, listening in reverberation and background noise. The 20th-50th-80th percentiles are shown for each category.
Is performance as good as for those with normal hearing the gold standard for new hearing instruments? Or, can hearing aid users perform even better than those with normal hearing when fitted with the right technology? Lab studies say that the answer to the latter question is “yes”, as shown in a difficult listening-in-noise task (Froehlich, Freels and Powers, 2015). The most important question, of course, is if these lab data transfer to the real world. At least one realworld study has shown that when fitted appropriately (verified NAL-NL2), aided ratings for problems in reverberation and background noise for the hearing-impaired individuals are at least equal to those with normal hearing (Valente et al, 2017). The main point here is that regardless of how good a new product might be, real-world performance better than that of normal hearing listeners can be difficult.
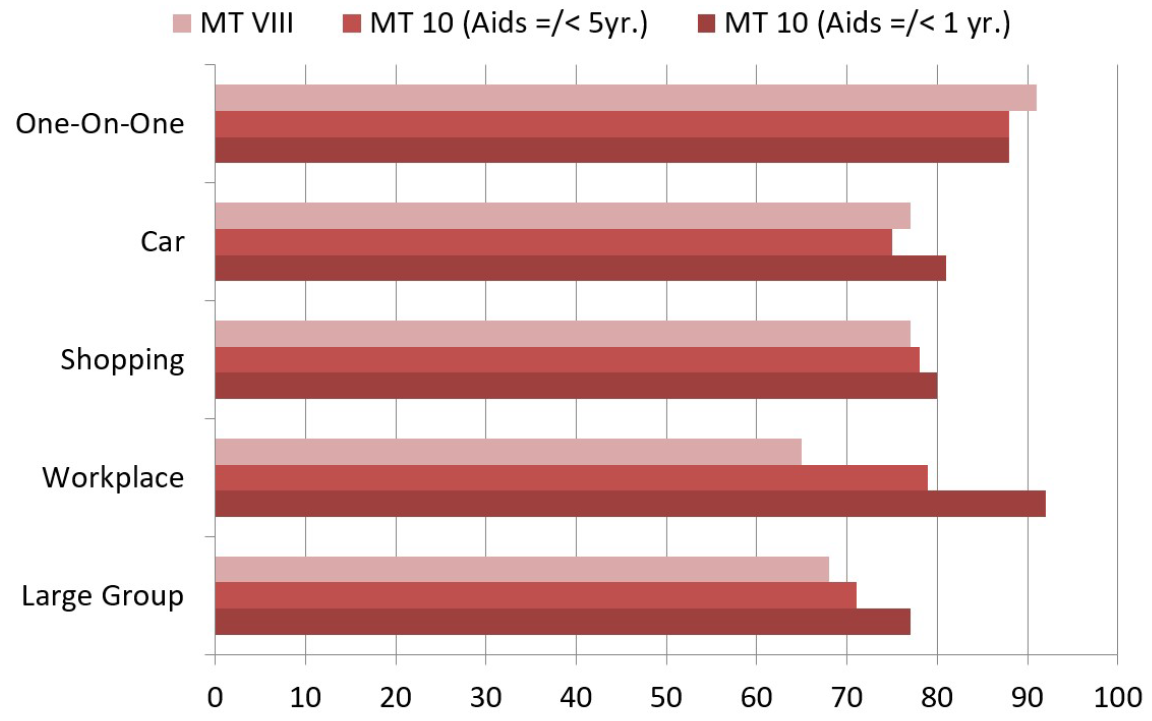
A second issue related to establishing the patient benefit for new products is the common measure of patient satisfaction. Again, what is the ceiling? For hearing aids, we have a long history of measuring satisfaction through the MarkeTrak and EuroTrak surveys. We have displayed some comparative satisfaction ratings from two different MarkeTrak surveys, which are shown in Figure 2. Illustrated are satisfaction ratings
for different listening situations from MarkeTrak VIII (~2010), 2019 MarkeTrak 10 (users of hearing aids =/> 5 years old) and MarkeTrak 10 (users of hearing aids =/< 1 year old). Note that for some listening conditions (e.g., one-on-one, in a car, while shopping) there has been little improvement in user satisfaction over the past ten years.
Figure 2. Satisfaction ratings for five different listening conditions. Data from MarkeTrak VIII and MarkeTrak 10 (owners using hearing aids =/< 1 year old, and owners using hearing aids =/< 5 years old).
Have we reached the “as-good-as-it-gets” levels for these listening conditions? On the other hand, note that there has been a larger improvement for listening in large groups, where in just the past few years we’ve gone from 71% to 77%. And how about satisfaction at the workplace, where ratings have gone from 65% in MarkeTrak VIII to 92% in MarkeTrak 10—a sizeable change over a tenyear period. These findings suggest that our satisfaction surveys need to include listening situations that are more specific, and directly relate to technology advances.
Breaking Through the Satisfaction Ceiling
In 2019 the Signia Xperience product was introduced. As reported by Froehlich, Freels and Branda (2019) and Froehlich, Branda and Freels (2019), early research has been very encouraging. Laboratory studies revealed excellent benefit for understanding speech in background noise, significant improvement for understanding talkers from the side and talkers while moving. Additionally, listening effort was significantly reduced when the new
Xperience features were activated.
Despite the potential ceiling effects for hearing aid satisfaction in the real world, there is reason to believe that the Xperience product can exceed commonly reported satisfaction survey data.
When Signia products have been compared head-to-head with other leading manufacturers, we know that:
Signia is significantly superior for speech understanding in different types of background noise (Branda, Powers and Weber, 2019).
Signia is equal or superior to other leading products for feedback reduction (Marcrum, Picou, Bohr, and Steffens, 2018).
Signia is significantly superior to other products for the naturalness of the user’s own voice (Froehlich, Powers, Branda and Weber, 2018).
These documented and time-tested benefits are all present with Xperience. In addition, the Xperience product has two new features that also have been shown to lead to high satisfaction (Froehlich, Freels and Branda, 2019):
An enhanced signal processing system to improve identification and interpretation of the acoustic scene. This advanced analysis considers such factors as: The overall noise floor, distance estimates for speech, noise and environmental sounds, the calculated signal-to-noise ratios, estimates of the azimuth of the primary speech signal, and determination of ambient modulations in the acoustic soundscape.
A second addition to the processing of the Xperience product are motion sensors to assist in the signal classification process, leading to a combined classification system named “Acoustic-Motion Sensors”. Using these acoustic-motion sensors, the processing of Xperience is effectively adapted when movement is detected.
As we take the features just described, we can envision that when working in synchrony across a wide range of listening situations, there is the potential for higher user satisfaction than typically reported. It therefore seemed reasonable to design a survey to test this assumption.
Field Validation of Satisfaction
The benefits provided by the Xperience product were validated by a multi-site satisfaction survey. The survey was conducted by several hearing care professionals located in three different countries: The United States, South Africa and Germany.
Methods
Participants: All participants (n=56) had bilateral, symmetric hearing losses and were experienced full-time hearing aid users, who reported satisfaction with their current instruments. There were 39 males and 17 females. The majority of the participants were retired (57%). All participants were able to access and navigate the online questionnaire via their own desktop or mobile device.
Hearing Aids: The experimental hearing aids used in the study were Signia Xperience Pure 312 7X, fitted using the CONNEXX software 9.1 to the X-Fit rationale. Click sleeve and click dome couplings were used, selected by the hearing care professional to be appropriate for each participant’s hearing loss severity and configuration.
Own Voice Processing training and activation were conducted according to need. Other special features were at default setting. Finetuning was minimal.
Comparison instruments: The comparison instruments were the participant’s own hearing aids. No changes in the programming of these instruments was conducted. The participants were using instruments from all major manufacturers, with the majority (41%) Siemens/Signia products. Seventy-one percent used their hearing aids at least 10 hours/day.
Procedure: Participants were recruited by the offices of the participating hearing care professionals. The study began with baseline satisfaction ratings for the participant’s own hearing aids, and over the next seven weeks they completed an additional satisfaction survey for their own instruments, and two satisfaction surveys for the Xperience product.
The satisfaction survey included ratings for 11 different listening situations/attributes and an overall rating of satisfaction. The ratings for these questions were modeled after MarkeTrak/EuroTrak, using a 7-point scale ranging from 1=Very Dissatisfied, 4=Neutral to 7=Very Satisfied.
Three additional questions required the participants to choose between their own hearing aids and the Xperience devices for listening effort, speech understanding, and overall preference. The ordering of products/surveys is summarized below:
Day of Fitting
Complete satisfaction survey for their own hearing aids
Fitted with Xperience hearing aids
Use Xperience hearing aids for three weeks
Week Three
Instructed to complete online satisfaction survey for Xperience hearing aids
Instructed via online message to switch back to their own hearing aids
Use own hearing aids for two weeks
Week Five
Instructed to complete online satisfaction survey for their own hearing aids
Instructed via online message to switch back to the Xperience hearing aids
Use Xperience hearing aids for two weeks
Week Seven
Complete online satisfaction survey for Xperience hearing aids
Select overall hearing aid preference
Results
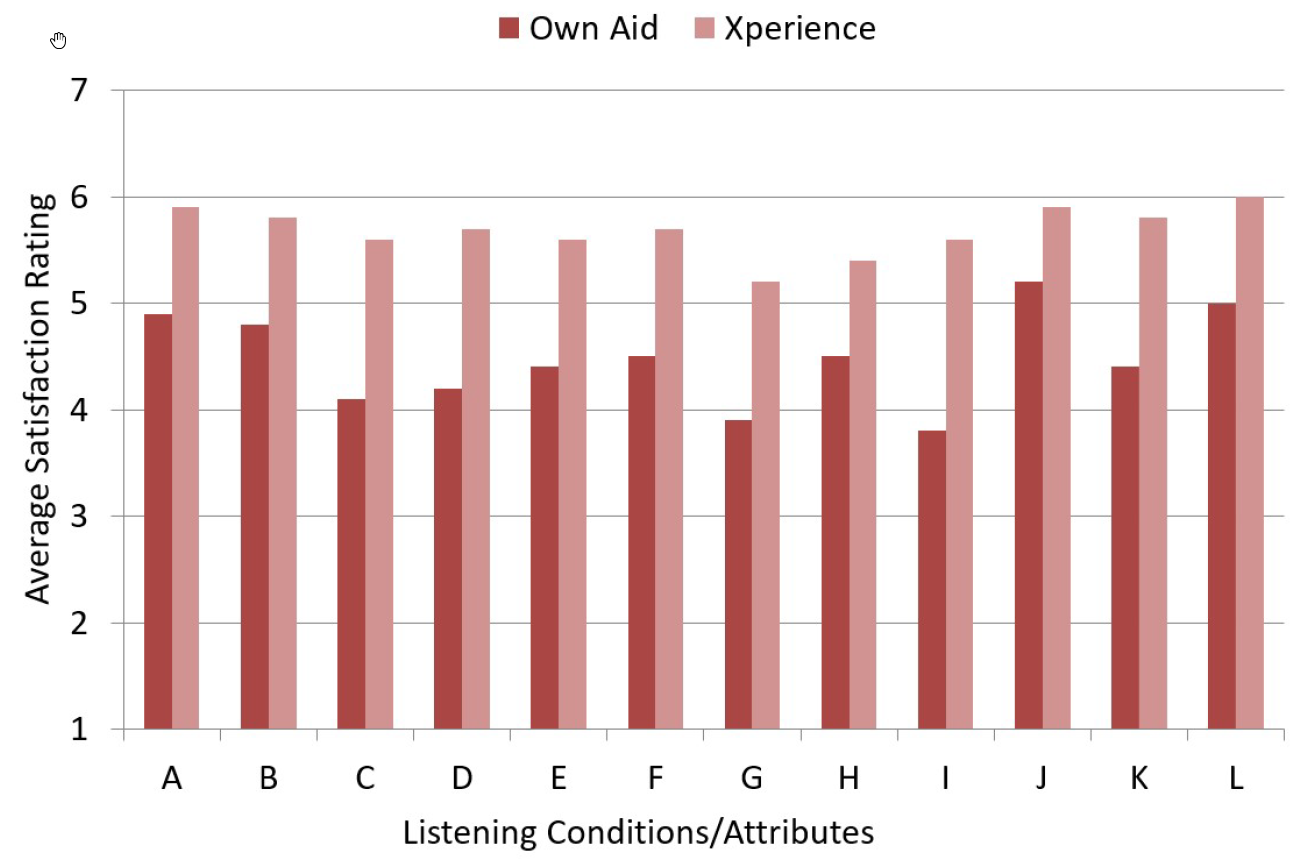
For statistical analysis, the means for each question were calculated for both the participant’s own hearing aids and the Xperience product. These findings are displayed in Figure 3. Recall that two satisfaction ratings were conducted for each product. The ratings of the second survey were used, as this represented direct back-toback comparisons, the longest wearing time, and therefore, would be expected to be the most reliable. A clear preference for the Xperience product is shown, where in general, satisfaction was increased by one satisfaction category. For example, mean overall satisfaction (Figure 3; Column L) increased from 5.0 (somewhat satisfied) to 6.0 (satisfied). For all of the conditions/attributes of the questionnaire, the improvement provided by Xperience was significant at the p<.01 level.
Figure 3. Mean satisfaction rating (7-point scale; 7=highest satisfaction) for the Xperience hearing aids and the participant’s own hearing aids for different listening conditions and sound attributes. A=Overall sound quality; B=Natural sounding; C=Understanding speech from behind; D=Understanding speech while in a car; E=Understanding speech from the TV; F=Quality of speech from the TV; G=Understanding speech in background noise while walking outside; H=Comfort with loud sounds; I=Ability to hear soft speech; J=Sound of own voice; K=Overall understanding in all situations; L=Overall satisfaction.
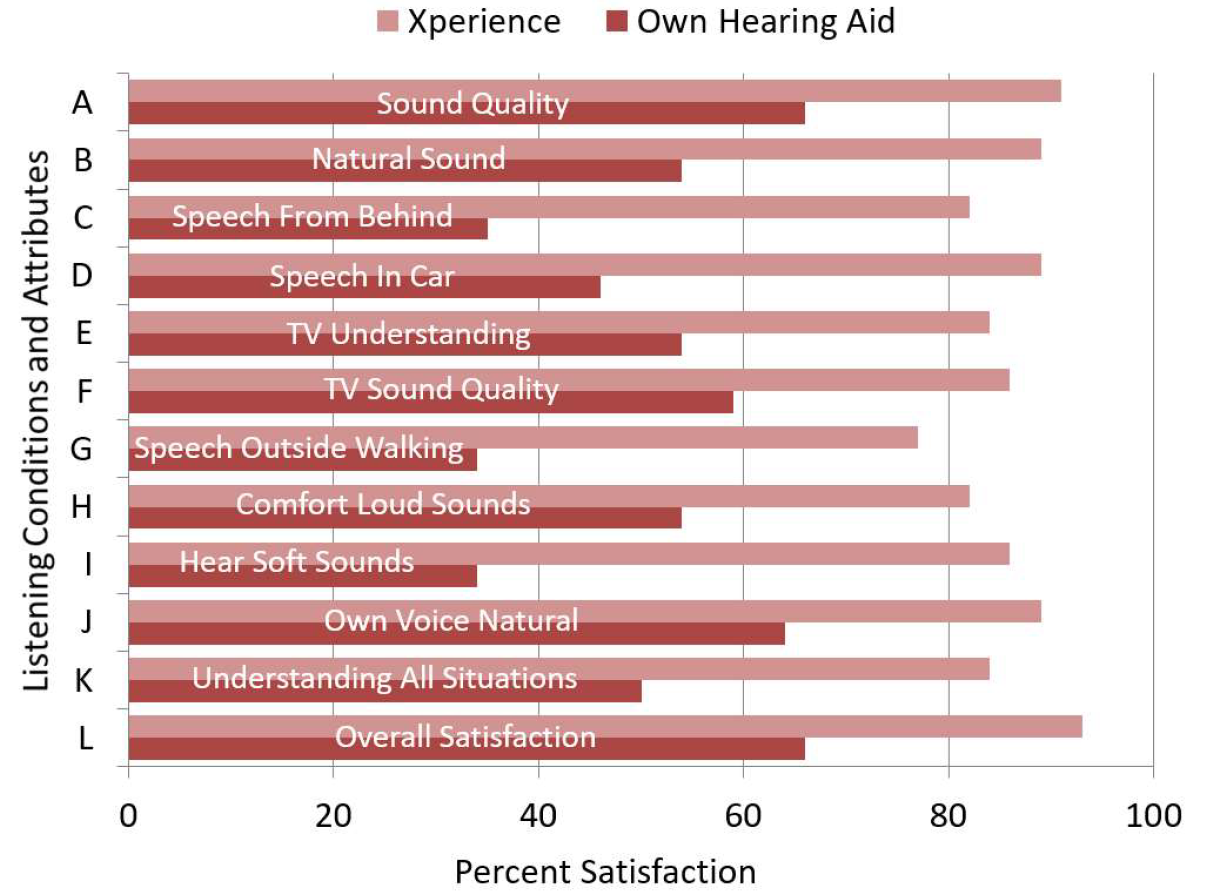
Figure 4. Percent satisfaction for the Xperience hearing aids compared to the participant’s own hearing aids for different listening conditions and attributes of sound. Values represent ratings of “somewhat satisfied”, “satisfied”, and “very satisfied”.
Another way to view the findings from the questionnaire is to determine what percent of the participants had a “satisfied” rating for a given item for each hearing aid condition. This is the sum of the ratings of #5 (somewhat satisfied), #6 (satisfied) and #7 (very satisfied). This approach has been commonly used by both MarkeTrak and EuroTrak. The results of this analysis are shown in Figure 4. Consistent with the mean data shown in Figure 3, observe high satisfaction for Xperience for all items, with considerably higher satisfaction ratings than the participants reported for their own hearing aids. Note that the highest satisfaction reached for any of the items was around 90%. As we discussed in the introduction, we cannot forget that even normal hearing individuals have some problems in most all listening environments (see Figure 1), and hence, it is promising that Xperience wearers are reporting comparable levels of satisfaction.
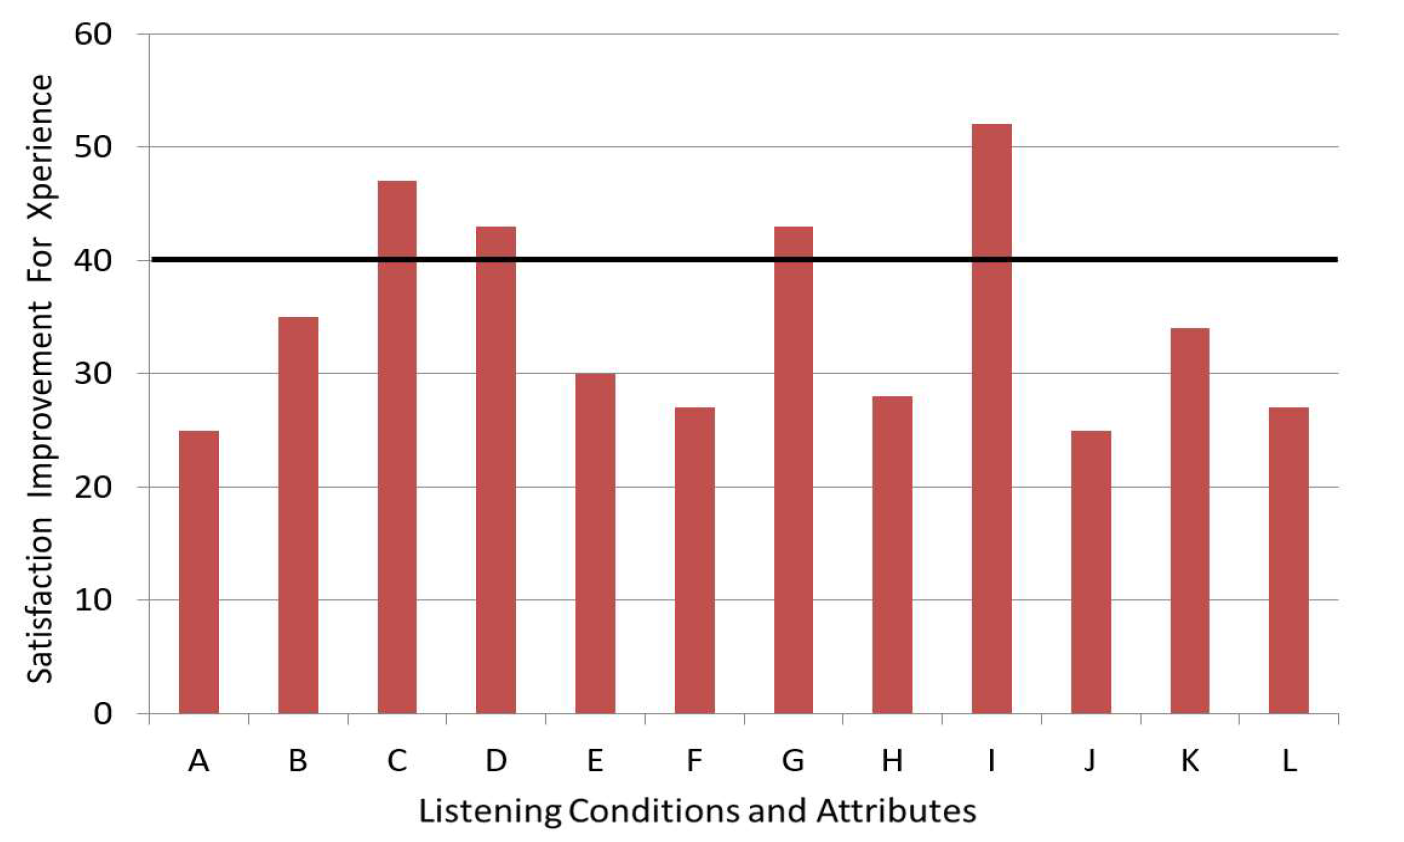
The significance of the Xperience satisfaction ratings can be demonstrated by comparing them to a standardized survey such as EuroTrak. Four of the items used in our Questionnaire were the same as used in EuroTrak surveys. If we look at a recent EuroTrak survey (Germany, 2018) we see substantially higher ratings for Xperience for all areas. For example, ratings were higher for understanding TV (86% vs. 76%), understanding in a car (89% vs. 78%), and comfort for loud sounds (82% vs. 66%). The largest difference was for “natural sounding” where EuroTrak was 71%, and satisfaction with Xperience was 89%. In viewing Figure 4, it is interesting to observe that the differences between satisfaction for Xperience and the participants own hearing varies among the different items. To look at this more closely, we have plotted the differences (Xperience advantage), displayed on Figure 5.
While all advantages are quite large, notice that four items have an Xperience advantage of over 40%: Speech from behind, Speech understanding in a car, Speech-in-noise while walking outside, and Ability to hear soft speech.
Figure 5. Improvement in percent satisfaction obtained using Xperience vs. the participants own hearing aids for different listening situations and attributes of sound. A=Overall sound quality: B=Natural sounding; C=Understanding speech from behind; D=Understanding speech while in a car; E=Understanding speech from the TV; F=Quality of speech from the TV: G=Understanding speech in background noise while walking outside; H=Comfort with loud sounds; I=Ability to hear soft speech; J=Sound of own voice; K=Overall understanding in all situations; L=Overall satisfaction.
If we consider the features of the Xperience product, which we discussed earlier, these findings fit into place in a predictable manner. First, Xperience will identify the direction of a speech source from any azimuth. Depending on what is most appropriate for the situation, Xperience can adjust the directional polar plot to focus on this speech signal, while reducing inputs from other azimuths, or adjust the polar pattern to provide accessibility to the speech signal without compromising situational awareness. Adding to this is the advanced signal processing of the acoustic soundscape. These unique features would explain the large benefit for both speech from behind, and speech understanding in a car (where the talker usually is not in front of the listener).
The large benefit for understanding speech in noise while walking outside is also expected, as this demonstrates the user advantages of the new integrated acoustic-motion sensors, which has been documented in previous research to lead to high satisfaction (Froehlich, Freels and Branda, 2019). This feature is not present in other hearing aids, including previous products from Signia, which explains the large advantage perceived in this type of listening situation.
Perhaps the most interesting, and also the largest advantage for Xperience when compared to the participant’s own hearing aids was satisfaction for hearing soft sounds. We suspect that this partially was due to the enhanced auditory scene processing of the Xperience, where speech from non-direct azimuths is identified. It is also possible that the Signia X-Fit provided more audibility for soft sounds than the algorithm used for the participants’ own hearing aids. A final contributing factor likely was the industryleading feedback reduction system of the Signia product line. We know that many hearing aid users, especially when open fittings are employed, simply increase the gain of their instruments until they hear feedback, and then back off a little. Because of the high-gain-before-feedback possible with the Xperience, this may have resulted in increased gain for soft sounds.
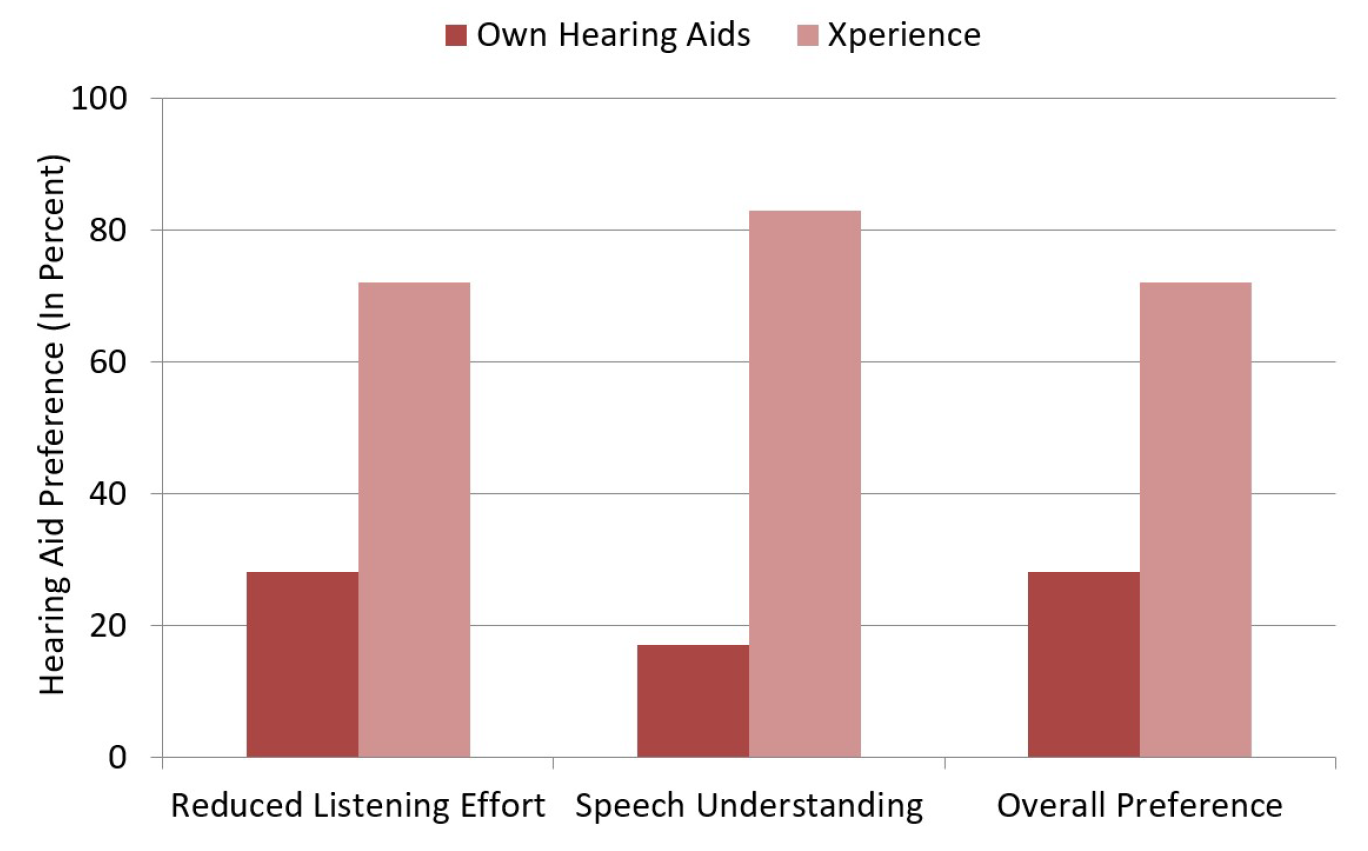
In addition to the satisfaction survey items just discussed, at the end of the study, three additional preference questions were asked. The results of these are shown in Figure 6.
Observe that the majority of participants preferred the Xperience for reducing listening effort and improving speech understanding. Overall reference also was significantly in favor of Xperience. All participants made notes regarding why their final choice was for one product or the other.
It is important to point out that several of the participants who stated a preference for their own hearing aids stated that they did so because the ear-piece for the Xperience was uncomfortable, and they preferred the comfort of their own hearing aids. Obviously, this is something that would be easily fixed in everyday practice, so we would expect an even bigger advantage for Xperience.
Figure 6. Preference indicated by participants in regard to three questions: Which hearing aids require the least listening effort in daily life? Which hearing aids provide the best speech understanding across all listening situations? And Which hearing aids do you prefer?
Summary
Since the early MarkeTrak data of 30 years ago, it has been common to assess hearing aid technology advancements through the use of real-world satisfaction surveys of hearing aid users. And indeed, over the years, satisfaction has continued to improve for nearly all areas that have been assessed, to the point that for some listening situations, there is little room for further improvement. The new features of the Xperience product, however, warranted a satisfaction survey to validate the expected benefits.
The results of this research revealed high satisfaction ratings for all the listening conditions and sound attributes that were assessed—considerably higher than a recent EuroTrak survey. Moreover, the satisfaction ratings were significantly higher than those for the participants’ own hearing aids. In a predictable manner, the new features of Xperience resulted in the largest advantages for Xperience for specific listening situations related to these technology advances. While laboratory studies are necessary to determine the efficacy of new features, the effectiveness of these features needs to be measured through real-world assessment of benefit and satisfaction.
The Signia Xperience passed the test.
References
Branda E, Powers T, Weber J. (2019) Clinical comparison of premier hearing aids. Canadian
Audiologist. 6 (4).
Cox RM (1997) Administration and application of the APHAB. Hearing Journal 50(4): 32-38.
Froelich, M., Freels, K, & Powers, T. (2015, May). Speech recognitions benefit obtained from binaural beamforming hearing aids: comparison to omnidirectional and individuals with normal hearing. AudiologyOnline, Article 14338. Retrieved from https://www.audiologyonline.com./
Froelich, M., Powers, T., Branda, E., & Weber, J. (2018, April). Perception of own voice wearing hearing aids: why “natural” is the new normal. AudiologyOnline, Article 22822. Retrieved from https://www.audiologyonline.com./
Froelich, M., Freels, K. & Branda, E. (2019). Dynamic soundscape processing: research supporting patient benefit. AudiologyOnline, article 26217. Retrieved from https://www.audiologyonline.com./
Froehlich M, Branda E, Freels K. New dimensions in automatic steering for hearing aids: Clinical and real-world findings. Hearing Review. 2019;26(11):32-36.
Marcrum S, Picou E, Bohr C, and Steffens T. (2018) Feedback reduction system influence on additional gain before feedback and maximum stable gain in open-fitted hearing aids. International Journal Audiology. 57 (10): 737-745.
Valente M, Oeding K, Brockmeyer A, Smith S, Kallogjeri D. (2018) Differences in Word and Phoneme Recognition in Quiet, Sentence Recognition in Noise, and Subjective Outcomes between Manufacturer First-Fit and Hearing Aids Programmed to NAL-NL2 Using Real-Ear Measures. J Am Acad Audiol. 29(8):706-721.
Eric Branda, AuD, PhD
Dr. Eric Branda is an Audiologist and Director of Research Audiology for Sivantos in the USA. For over 20 years, Eric has provided audiological, technical and product training support around the globe. He specializes in bringing new product innovations to market, helping Sivantos fulfill its goal of creating advanced hearing solutions for all types and degrees of hearing loss. Dr. Branda received his PhD from Salus University, his AuD from the Arizona School of Health Sciences and his Master’s degree in Audiology from the University of Akron.
Erik Harry B. Høydal
Erik Harry B. Høydal has been with WS Audiology since 2014. Besides his audiological clinical background, Erik has been involved in research on musicians and tinnitus. He did his MSc in Clinical Health Science at the Norwegian University of Science and Technology (NTNU), and has also worked as a teacher at the Program for Audiology in Trondheim. Høydal has worked politically with awareness of hearing impairment through his engagement in The Norwegian Association of Audiologists. Having joined WS Audiology in Erlangen 2016 his work includes scientific research and portfolio management.
Christina Hakvoort, MBA
Christina Hakvoort, currently heading the Premium Segment at Sivantos Product Management, has more than 10 years of experience in the hearing instrument business. Prior to joining Sivantos, she worked in the consumer good industry. Christina holds a degree in mechanical engineering and has an MBA from the European School of Management and Technology.